Distributed Tracing and Observability at Scale
Building observability with OpenTelemetry — trace propagation, span design, sampling strategies, and practical instrumentation patterns for distributed systems.

Akhil Sharma
March 6, 2026
Distributed Tracing and Observability at Scale
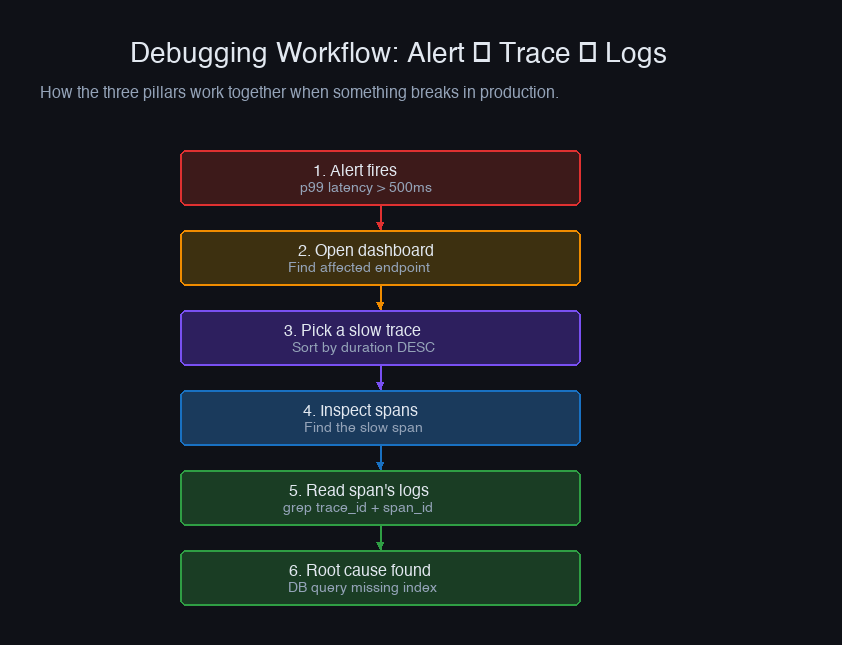
Logs tell you what happened. Metrics tell you how much. Traces tell you why. In a distributed system where a single user request touches 5-15 services, traces are the only way to understand the end-to-end flow and pinpoint where latency or errors originate.
The Three Pillars and How They Connect
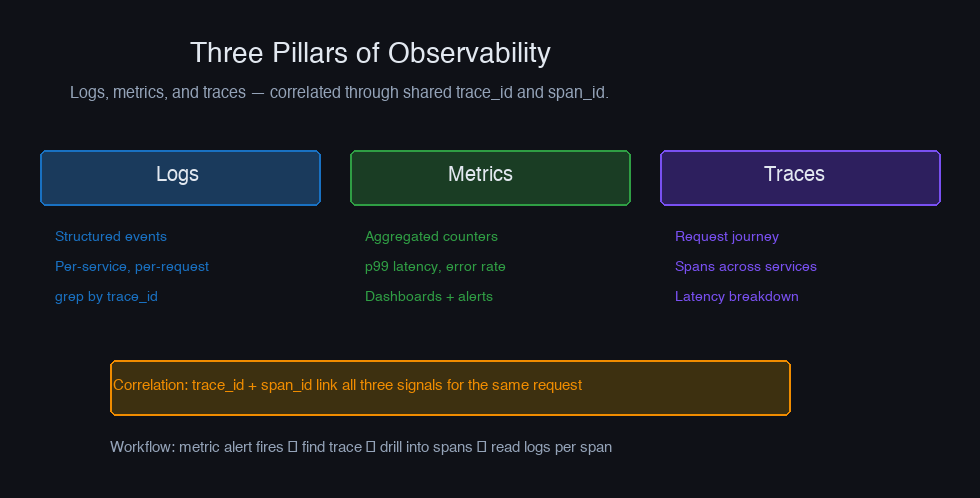
The key to useful observability is correlation. When you find a metric anomaly (p99 latency spike), you should be able to jump to the traces that contributed to it. When you find a problematic trace, you should be able to jump to the relevant logs. This requires embedding trace context (trace ID, span ID) in all three signals.
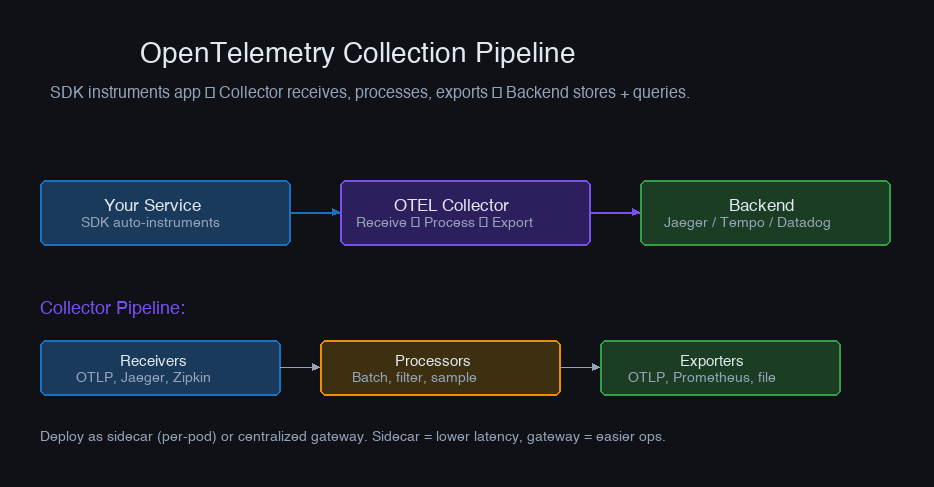
OpenTelemetry: The Standard
OpenTelemetry (OTEL) is the vendor-neutral standard for instrumentation. It provides SDKs for generating traces, metrics, and logs, plus a collector for routing telemetry to backends.
Basic Instrumentation (Python)
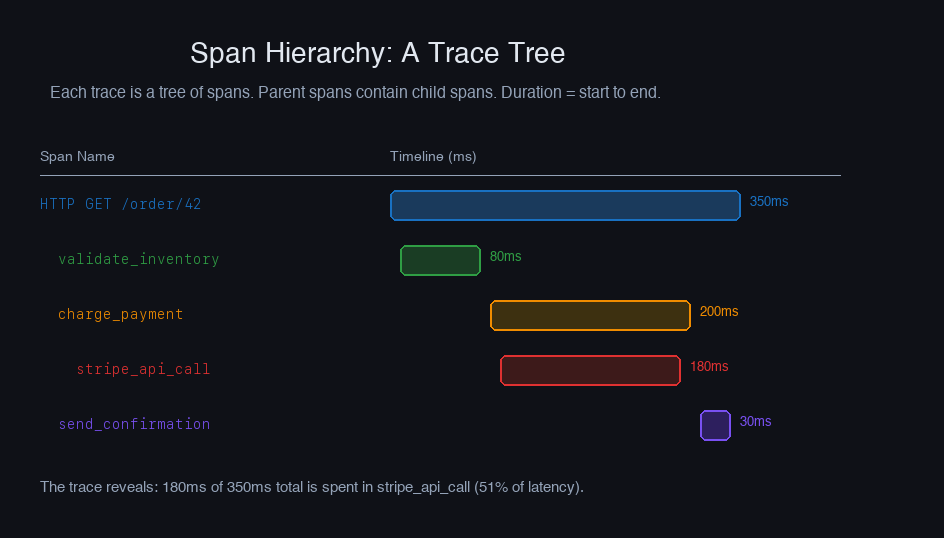
Span Design Principles
A span represents a unit of work. Too few spans and you can't pinpoint issues. Too many spans and you drown in noise (and pay massive storage costs).
Rule: One span per meaningful operation. Create spans for:
- Inbound HTTP/gRPC requests (auto-instrumented)
- Outbound HTTP/gRPC calls (auto-instrumented)
- Database queries (auto-instrumented)
- Message queue produce/consume
- Business logic phases (order validation, payment processing)
- Cache operations (only if they're a common bottleneck)
Don't create spans for: Utility functions, data transformations, in-memory operations that take microseconds.
Span Attributes That Matter
Attributes make spans searchable and useful for debugging:
Advanced System Design Cohort
We build this end-to-end in the cohort.
Live sessions, real systems, your questions answered in real time. Next cohort starts 2nd July 2026 — 20 seats.
Cardinality matters. An attribute with millions of unique values (request IDs, timestamps) makes indexing expensive and queries slow. Keep attributes to finite, bounded sets where possible.
Trace Propagation Across Boundaries
For distributed traces to work, the trace context (trace ID, span ID, trace flags) must propagate across service boundaries.
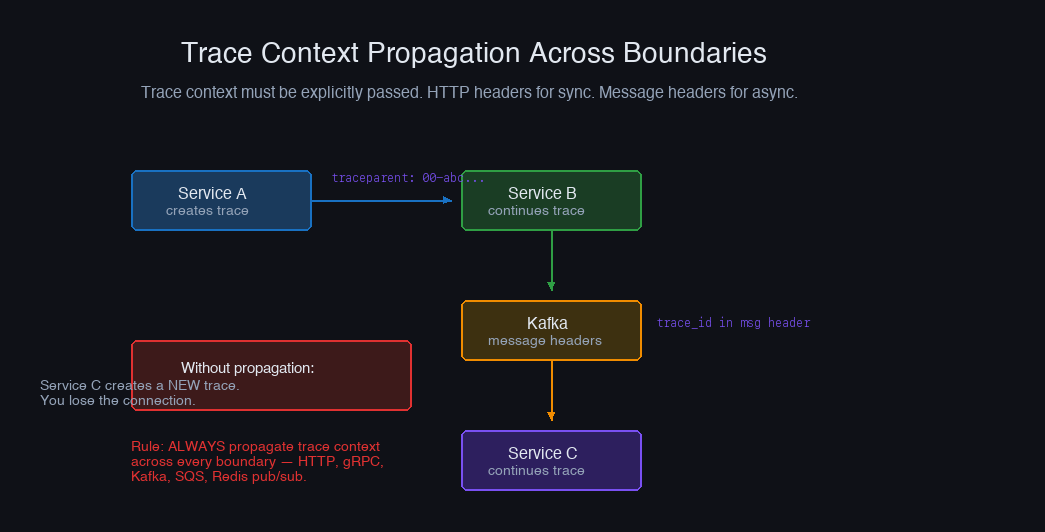
HTTP: The traceparent header (W3C standard):
Auto-instrumentation handles this for HTTP clients/servers. But you need to handle it manually for async boundaries.
Message queues: Inject trace context into message headers, extract on the consumer side:
Sampling Strategies
At high throughput, tracing every request is expensive. Storage costs, collector CPU, and network bandwidth all scale with trace volume. Sampling reduces volume while preserving observability.
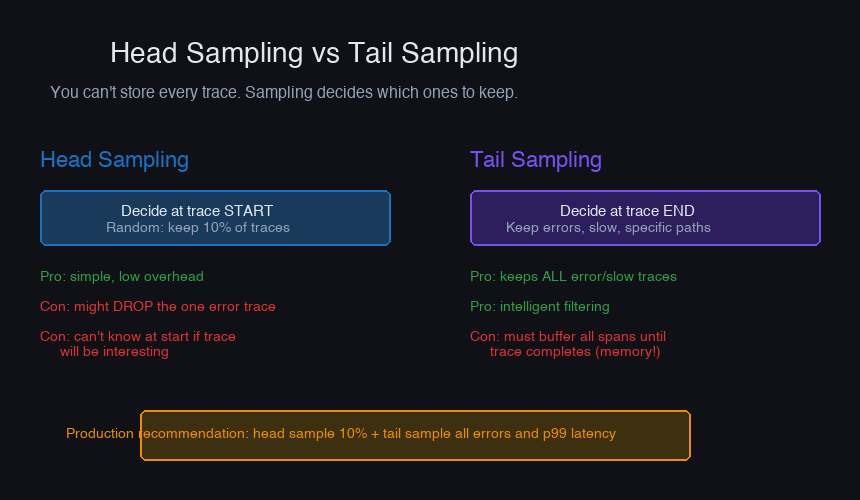
Head Sampling
Decide whether to sample at the start of the trace (before any spans are created). Simple but has a critical flaw: you don't know if the trace will be interesting yet.
Problem: If 1% of requests are errors, 10% head sampling means you capture only 0.1% of errors. The interesting traces are underrepresented.
Tail Sampling
Decide whether to keep a trace after it's complete — when you know the outcome (error, high latency, specific attributes). Requires buffering all spans until the trace completes.
The OTEL Collector supports tail sampling:
Trade-off: Tail sampling requires the collector to buffer traces in memory. At high throughput, this can consume significant RAM. Size your collector accordingly: num_traces × avg_spans_per_trace × avg_span_size.
Practical Sampling Strategy
Combine both approaches:
- Always sample errors, high-latency requests, and requests with specific debug headers
- Rate-limit sample frequent, successful requests (e.g., keep 100 traces/min per endpoint)
- Never sample health checks and readiness probes
Backend Selection
| Backend | Deployment | Query Performance | Cost | Best For |
|---|---|---|---|---|
| Jaeger | Self-hosted | Good | Storage costs | Teams with K8s |
| Grafana Tempo | Self-hosted | Good (TraceQL) | Object storage | Grafana users |
| Zipkin | Self-hosted | Basic | Storage costs | Simple setups |
| Datadog APM | SaaS | Excellent | High ($) | Enterprise |
| Honeycomb | SaaS | Excellent (BubbleUp) | Medium ($) | Debugging focus |
For cost-effective self-hosting, Grafana Tempo with S3/GCS backend is hard to beat — it uses object storage (cheap) and integrates with the Grafana ecosystem.
Correlating Traces with Logs
Embed the trace ID in every log line. When you find a problematic trace, you can search logs by trace ID to get full context:
This produces logs like:
Search trace_id=4bf92f3577b34da6... in your log aggregator to see every log line from every service for that request.
Common Mistakes
- Instrumenting everything. Not every function needs a span. Over-instrumentation makes traces unreadable and expensive.
- Ignoring async boundaries. Message queues, background jobs, and cron tasks need explicit context propagation. Without it, you get disconnected trace fragments.
- Not setting service.name. Without it, all spans look like they come from "unknown" and the trace is useless for identifying which service is slow.
- Storing PII in span attributes. Trace data is often retained for weeks and accessed by broad teams. Mask or omit user emails, IPs, and session tokens.
Distributed tracing is the most valuable observability signal for microservice architectures. Start with auto-instrumentation (it covers HTTP, database, and client calls with zero code), add manual spans for business logic phases, implement tail sampling to control costs, and correlate traces with logs via trace IDs. The investment pays for itself the first time you debug a cross-service latency issue in minutes instead of hours.
More in System Design
Building a Distributed Job Scheduler
Why single-node job schedulers silently fail in production, and how to build a distributed scheduler with leader election, task deduplication, and failure recovery.
Consistent Hashing in Practice
Why modulo hashing silently nukes your cache every time you scale, and how consistent hashing solves the rebalancing problem that takes down databases.