Important Website Metrics

Important Website Metrics
The metrics that tell you whether your website is fast enough — Core Web Vitals, TTFB, and the numbers that affect both user experience and SEO.
📊 Important Website Metrics: The Health Vital Signs
When you go to a doctor, they check your vital signs: blood pressure, heart rate, temperature. Websites have vital signs too! Let’s see the most important ones.
The Complete Page Load Journey
User types URL and hits Enter
━━━━━━━━━━━━━━━━━━━━━━━━━━━━━━━━
Timeline of Events:
━━━━━━━━━━━━━━━━━━━━━━━━━━━━━━━━
0ms ├─ User hits Enter
│ [Browser starts DNS lookup]
│
50ms ├─ TTFB Starts counting...
│ [Browser sends HTTP request]
│
200ms ├─ TTFB: First byte received! ⏱️
│ [Server responded, HTML starts arriving]
│
250ms ├─ FCP: First Content Paint! 🎨
│ [User sees SOMETHING on screen]
1200ms ├─ LCP: Largest Content Paint! 🖼️
│ [Main content visible]
1800ms ├─ Full Page Load Complete ✓
│ [All resources loaded]
│
3000ms └─ TTI: Time to Interactive! 👆
[Page fully responsive to clicks]
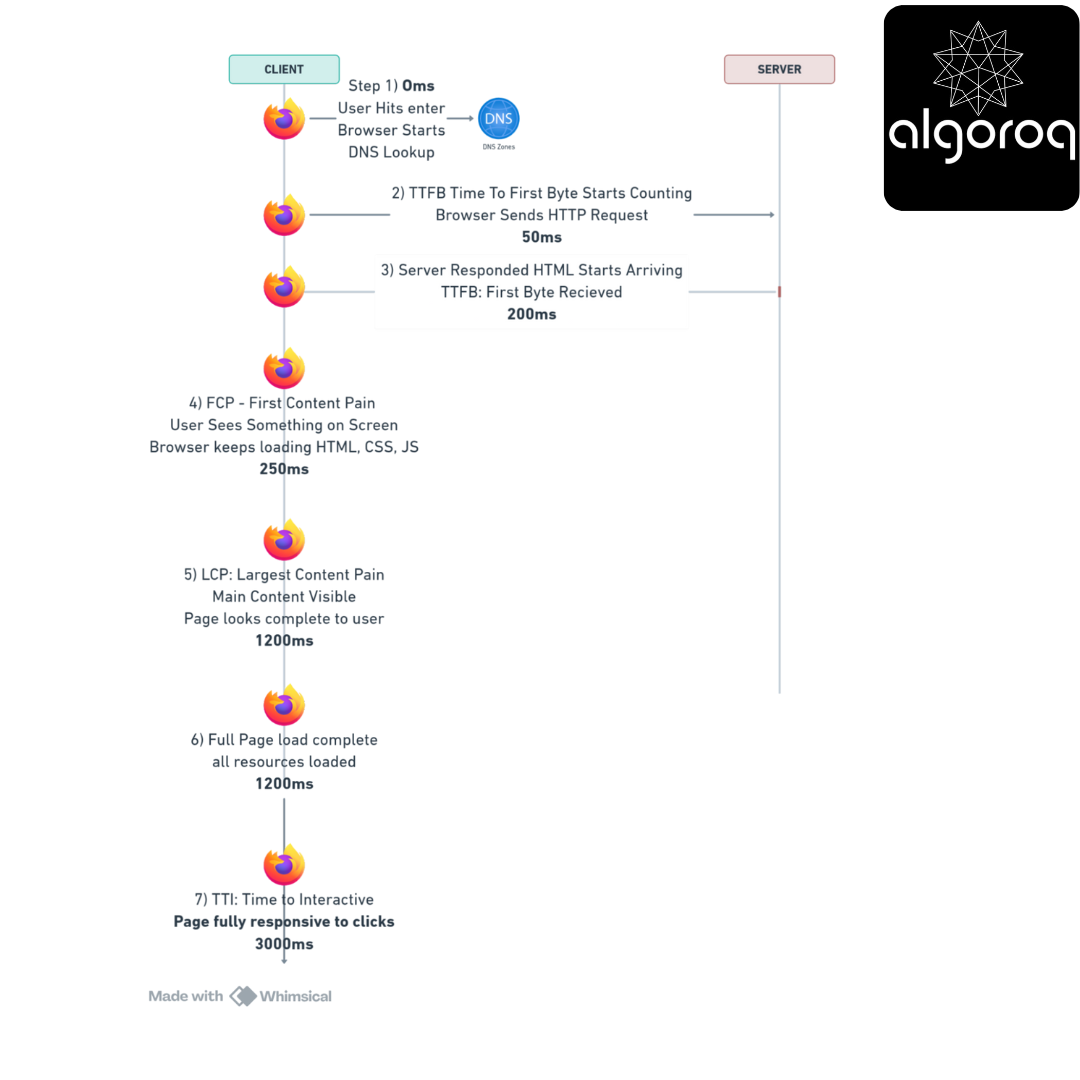
Let’s see each metric in detail:
1. Load Time (The Big Picture)
What it measures: Total time until page is completely loaded
The Newspaper Analogy:
━━━━━━━━━━━━━━━━━━━━━━━━━━━━━━━━
Imagine receiving a newspaper:
Load Time =
Time from ordering →
Until you have the complete newspaper →
With all articles, photos, ads loaded
Everything must be there!
How it's measured:
FCP: 3000ms (after CSS + JS load)
Fast FCP - After:
━━━━━━━━━━━━━━━━━━━━━━━━━━━━━━━━
FCP: 200ms (HTML renders immediately!)
4. LCP (Largest Contentful Paint): The Main Content Metric
What it measures: Time until the largest visible element loads
The Newspaper Front Page Analogy:
━━━━━━━━━━━━━━━━━━━━━━━━━━━━━━━━
Open a newspaper:
You don't care about:
-
The date in the corner (small text)
-
The page number (tiny)
-
The subscription ad (sidebar)
You care about:
-
The HEADLINE (big text)
-
The MAIN PHOTO (hero image)
-
The LEAD STORY
LCP = When that main content appears!
What Google Considers LCP:
Elements that can be LCP:
━━━━━━━━━━━━━━━━━━━━━━━━━━━━━━━━
✓ <img> elements
✓ <image> inside <svg>
✓ <video> poster images
✓ Background images via CSS url()
✓ Block-level text elements (<h1>, <p>, <div>)
The LARGEST of these in viewport = LCP
Visual Example:
E-commerce Product Page:
━━━━━━━━━━━━━━━━━━━━━━━━━━━━━━━━
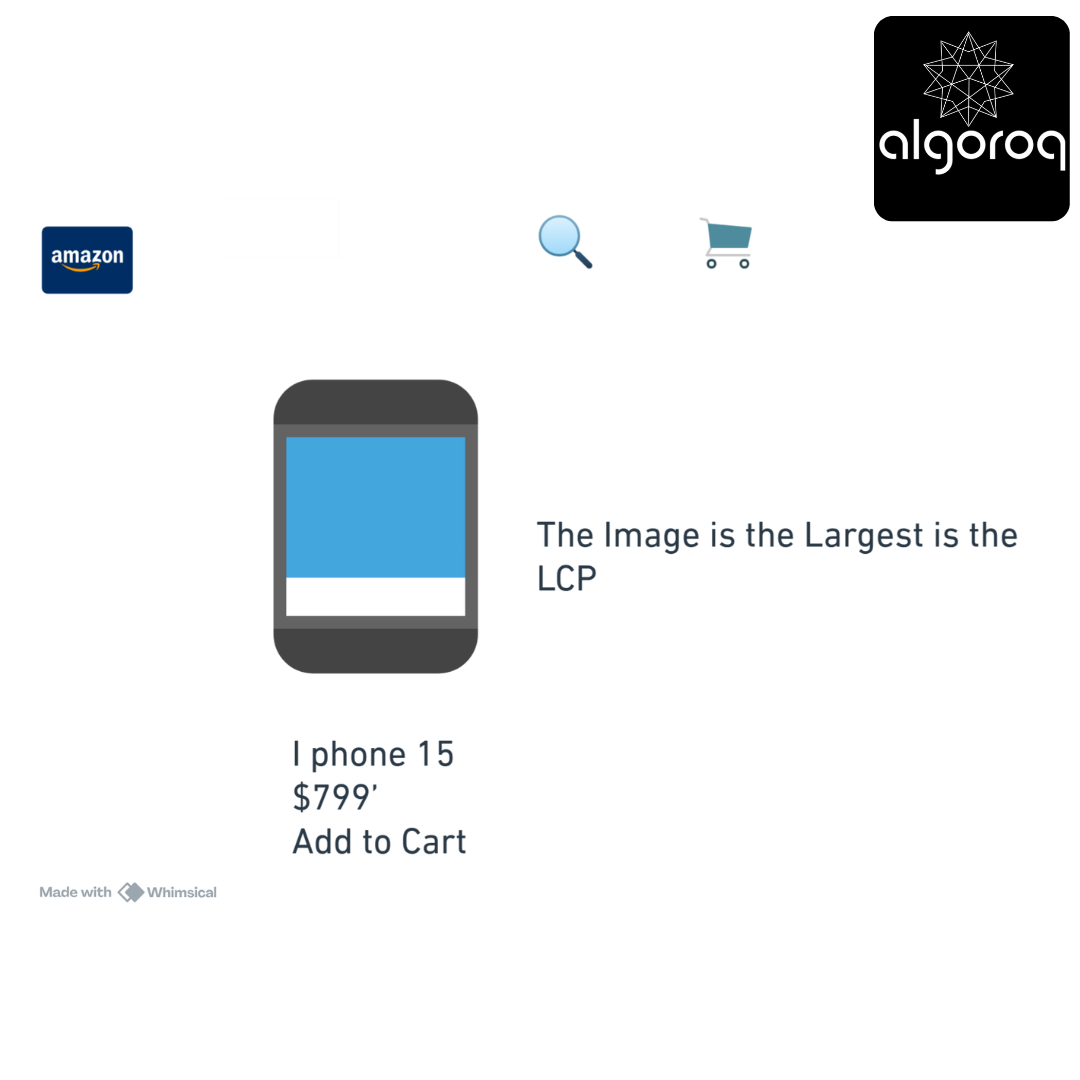
LCP = When that product image loads!
LCP Scoring:
Google's LCP Thresholds:
━━━━━━━━━━━━━━━━━━━━━━━━━━━━━━━━
0-2.5s: Good ✓✓✓ Fast page load Good user experience
2.5s-4s: Needs Improvement ⚠️ Acceptable but could be better Room for optimization
4s+: Poor ❌ User likely frustrated Immediate action needed
Real Problem & Solution:
Case Study: Blog with Slow LCP
━━━━━━━━━━━━━━━━━━━━━━━━━━━━━━━━
Initial state:
-
Hero image: 3MB uncompressed PNG
-
Hosted on slow server
-
No lazy loading
-
LCP: 6000ms ❌
User experience:
"I see the article text at 500ms, but the big header image doesn't load until 6 seconds later!"
Optimization steps:
━━━━━━━━━━━━━━━━━━━━━━━━━━━━━━━━
Step 1: Compress image to formats the WebP 3MB PNG now becomes a 150KB WebP Savings: 95%
Step 2: Use CDN Slow server (500ms) → CDN (50ms) Savings: 90%
Step 3: Add preload hint <link rel="preload" as="image" href="hero.webp"> Browser fetches early!
Step 4: Responsive images
<img srcset="hero-400.webp 400w,
hero-800.webp 800w,
Mobile users get smaller images!
Result:
━━━━━━━━━━━━━━━━━━━━━━━━━━━━━━━━
LCP: 800ms ✓✓✓
87% improvement!
The Metric Relationships
How Metrics Relate:
━━━━━━━━━━━━━━━━━━━━━━━━━━━━━━━━
Timeline:
━━━━━━━━━━━━━━━━━━━━━━━━━━━━━━━━

TTFB: Server responds
FCP: User sees SOMETHING
LCP: User sees MAIN content
Load: Everything done
Ideal relationships:
-
FCP < 2 × TTFB
-
LCP < 3 × FCP
-
Load < 2 × LCP
Key Takeaways
- Core Web Vitals measure real user experience — LCP (loading), FID/INP (interactivity), and CLS (visual stability)
- Time to First Byte (TTFB) measures server response speed — optimize with caching, CDNs, and database query performance
- Apdex score summarizes user satisfaction in a single number — based on response time thresholds (satisfied, tolerating, frustrated)
- Monitor both synthetic and real user metrics — synthetic catches regressions in CI, RUM captures actual user experience
Unlock with Pro
Unlock the full content and everything at this level.
Get Pro — $9/moAlready a member? Log in